
BetterHelp is an online therapy platform that provides therapy services via messaging, phone, and video sessions.
Since it's launch in 2013, BetterHelp has grown to over 5 million users, and over $1.03 billion in annual revenue.
BetterHelp also boasts over 34,000 licensed, accredited, and experienced therapists and physchologists.
On this page, you'll find the latest statistics on BetterHelp's growth to date.
- BetterHelp Stats (Highlights)
- BetterHelp revenue
- BetterHelp paying users
- BetterHelp how many therapists?
- BetterHelp podcast marketing ad spend
- BetterHelp market share
- BetterHelp app downloads
- BetterHelp gender demographics
- BetterHelp age demographics
- BetterHelp most popular countries
- BetterHelp ratings
- How many people work at BetterHelp
BetterHelp Stats (Highlights)
- BetterHelp has over 34,000 licensed therapists & psychologists.
- Annual BetterHelp revenue was 1.03 billion dollars in 2024.
- BetterHelp spent over 100 million dollars on advertising in 2023.
- Worldwide, women use BetterHelp more than men.
BetterHelp revenue
BetterHelp generated a total of $1.03 billion dollars in revenue in 2024. Compared to the previous year, BetterHelp saw a 8.75% decrease in annual revenue.
2.jpg)
BetterHelp generated $249.8 million in revenue in Q4 2024, an decrease of 2.73% compared to the previous quarter.
Here's a table charting BetterHelp's revenue since 2021:
| Year | Revenue |
|---|---|
| 2021 | $720 million |
| 2022 | $1.019 billion |
| 2023 | $1.132 billion |
| 2024 | $1.033 billion |
BetterHelp paying users
BetterHelp has 400k paying users. A further 2,000 paying customers were added in Q3 2024.
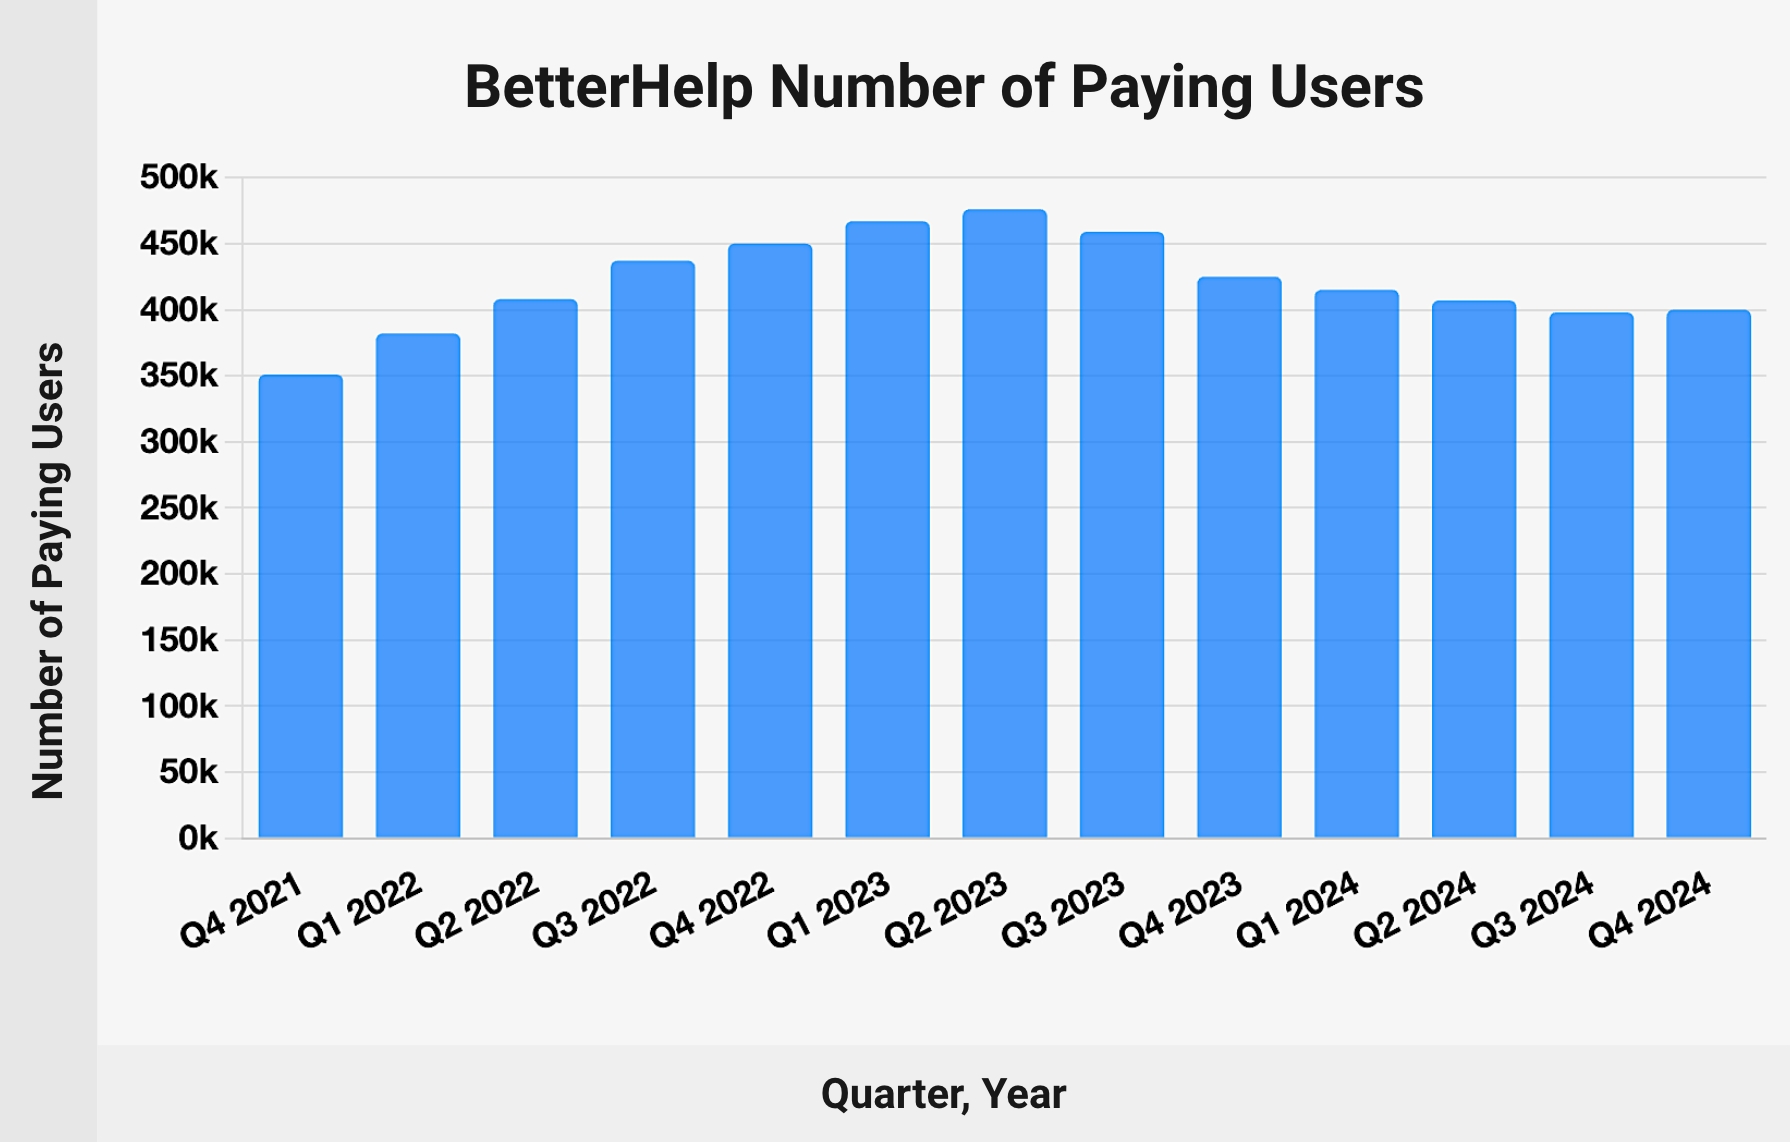
BetterHelp's customer base has grown 14% since 2021.
We've charted BetterHelp's number of paying users growth since 2021 (by quarter):
| Quarter | Paying Users |
|---|---|
| Q4 2021 | 351,000 |
| Q1 2022 | 382,000 |
| Q2 2022 | 408,000 |
| Q3 2022 | 437,000 |
| Q4 2022 | 450,000 |
| Q1 2023 | 467,000 |
| Q2 2023 | 476,000 |
| Q3 2023 | 459,000 |
| Q4 2023 | 425,000 |
| Q1 2024 | 415,000 |
| Q2 2024 | 407,000 |
| Q3 2024 | 398,000 |
| Q4 2024 | 400,000 |
Source:
SECBetterHelp how many therapists?
BetterHelp has over 34,000 licensed therapists working for the platform. A growth of 36% since from the year prior.
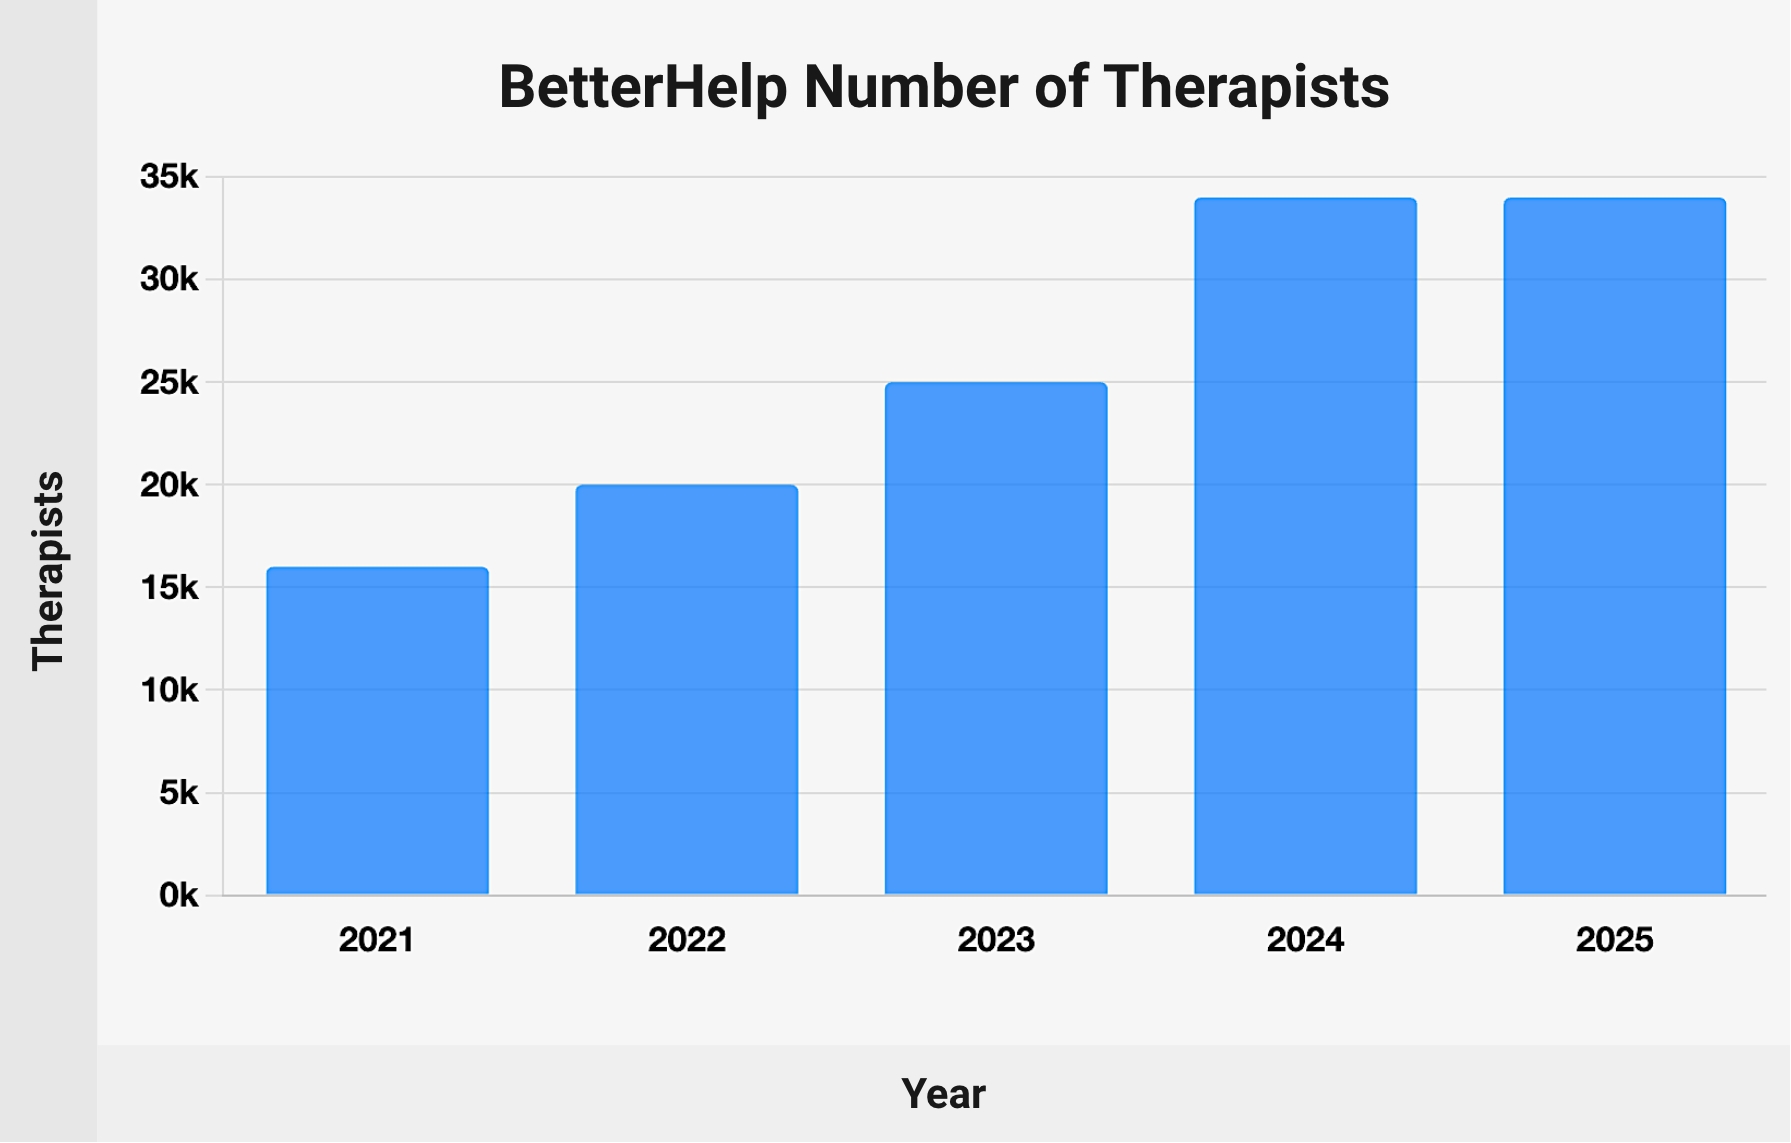
The number of therapists has grown 112% over the past 4 years.
According to BetterHelp, only about 15% of therapists who apply are accepted to the platform.
Here's a table showing the number of BetterHelp therapists since 2021.
| Year | Number of Therapists |
|---|---|
| 2021 | 16,000 |
| 2022 | 20,000 |
| 2023 | 25,000 |
| 2024 | 34,000 |
| 2025 | 34,000 |
BetterHelp podcast marketing ad spend
BetterHelp spent 8.2 million dollars on podcast ads in March 2024 alone. Over the last 4 years BetterHelp has spent an average of 8.35 million dollars per month delivering podcast ads.
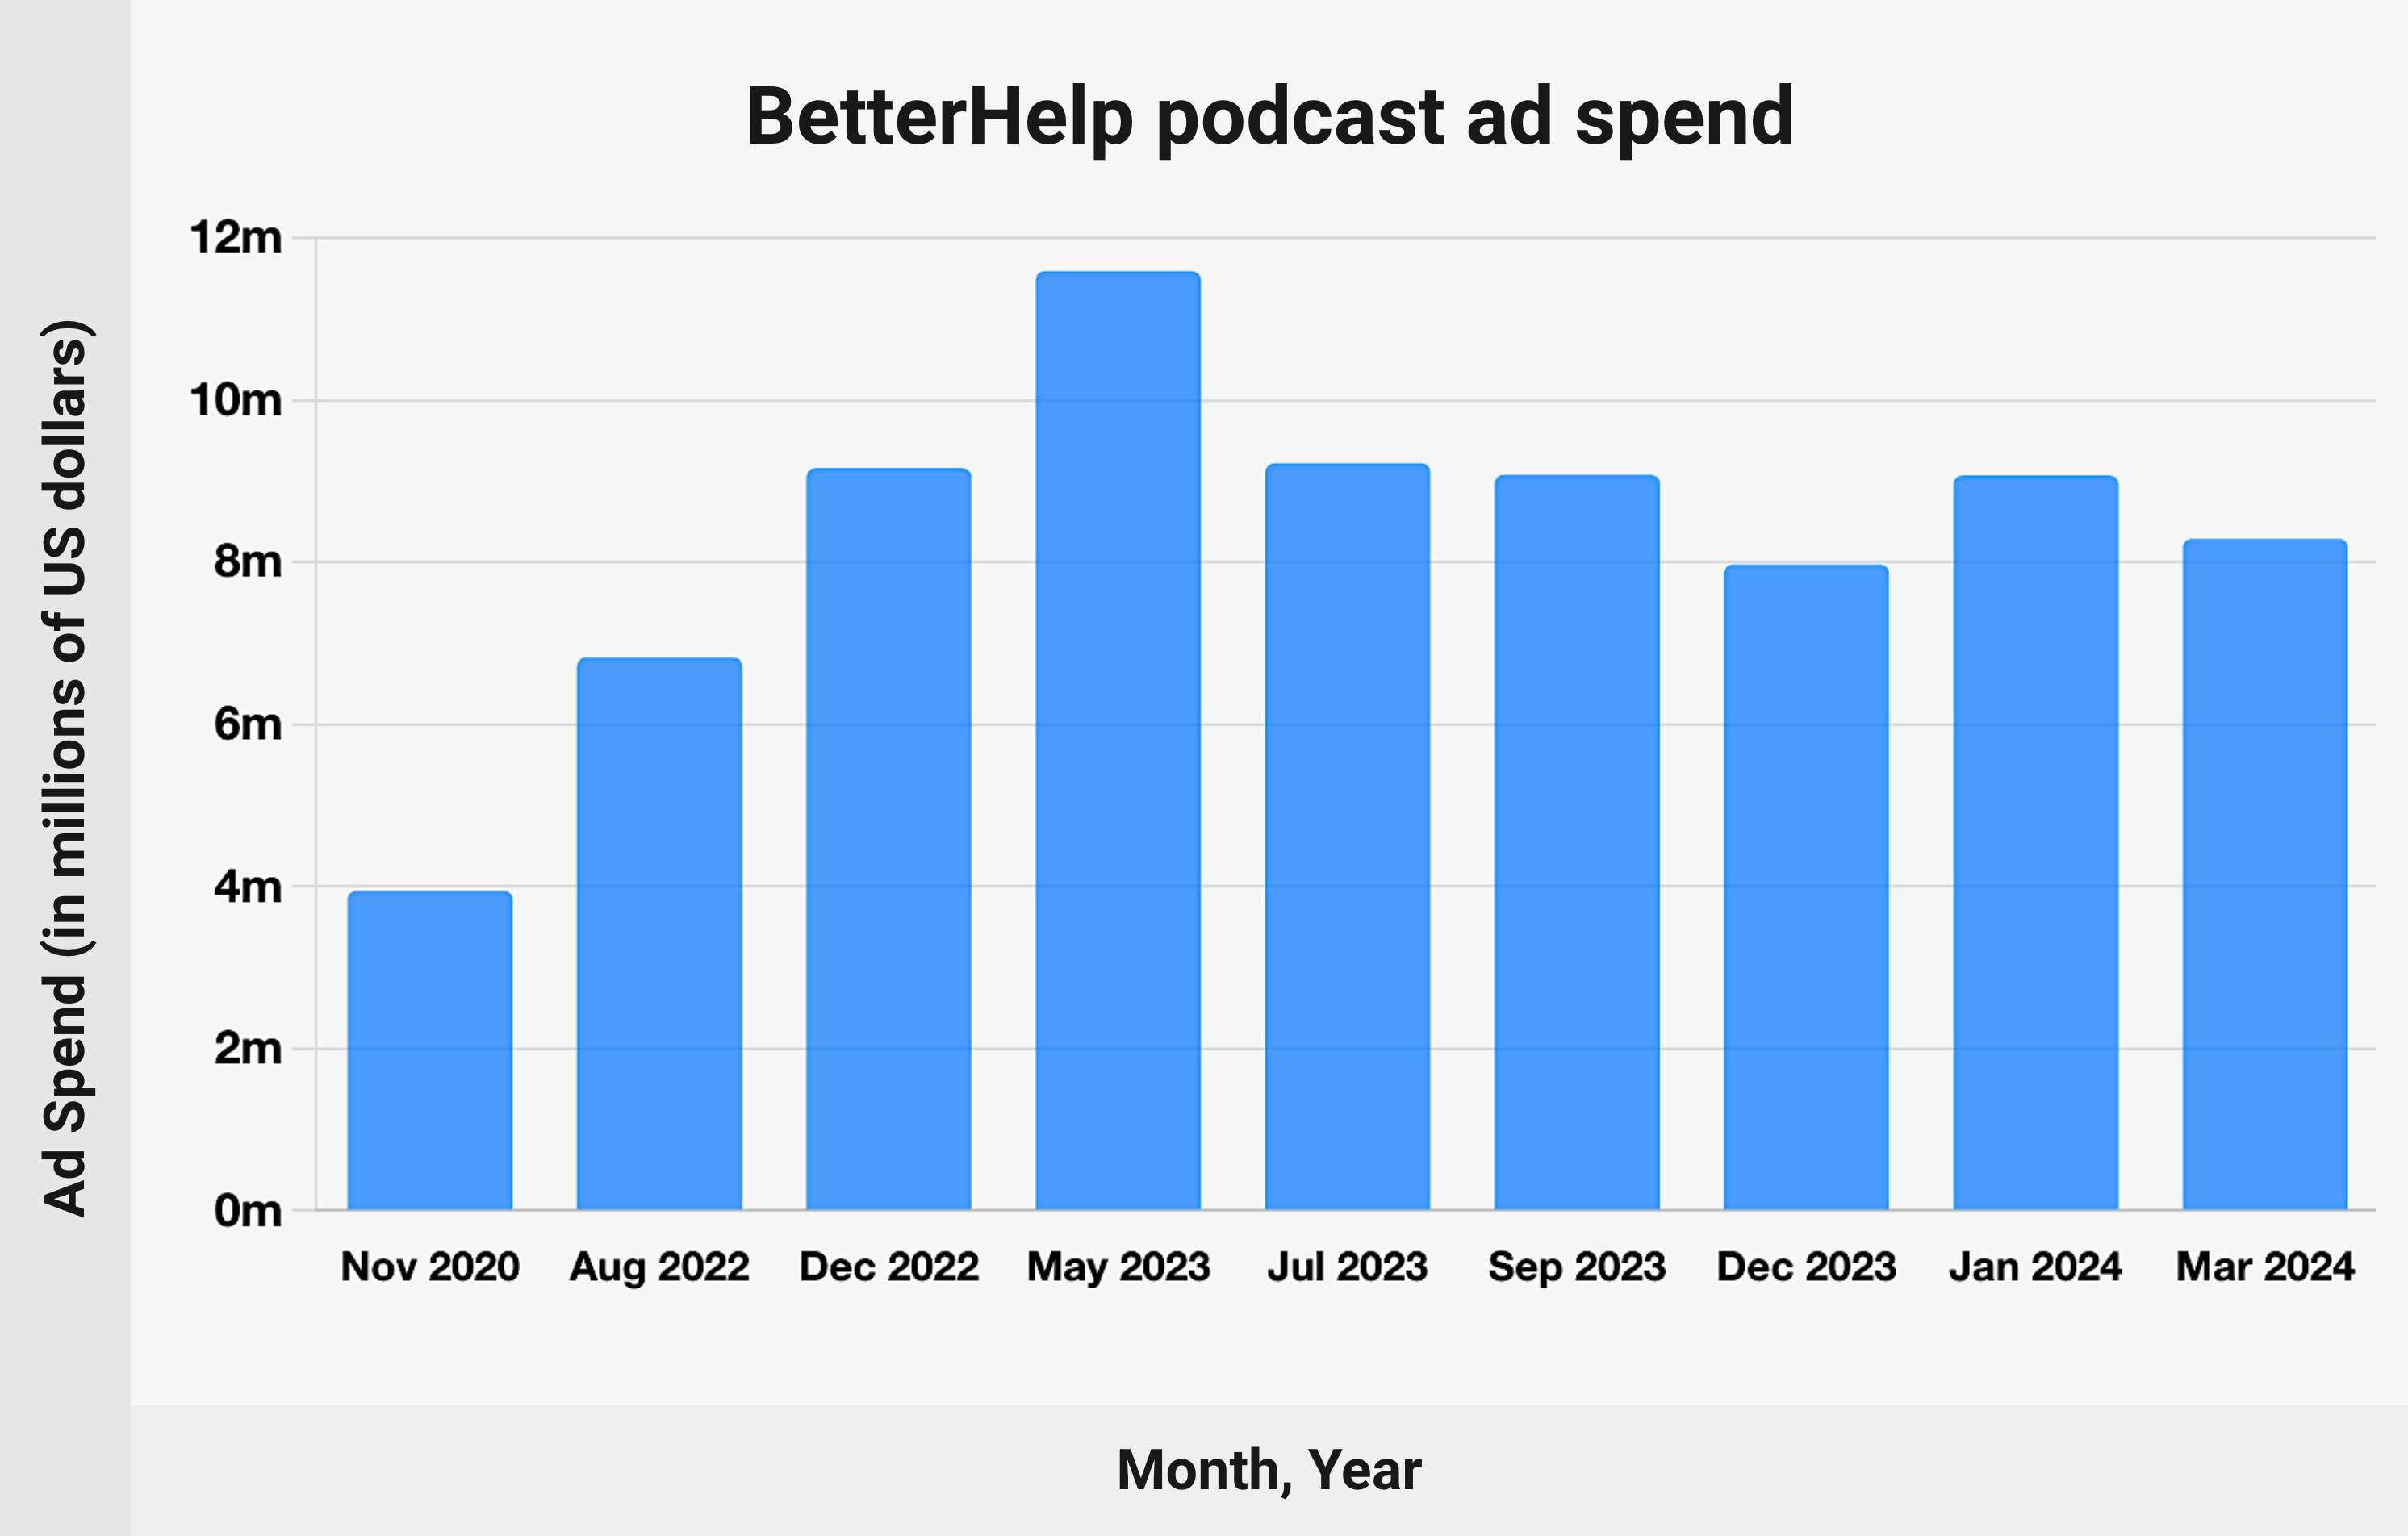
A approximate peak of 9.08 million dollars was spent on podcast ads in September 2023.
Here's a table showing BetterHelp's podcast marketing ad spend since 2020.
| Month | Podcast Marketing Spend |
|---|---|
| Nov 2020 | $3.94 million |
| Aug 2022 | $6.82 million |
| Dec 2022 | $9.16 million |
| May 2023 | $11.59 million |
| Jul 2023 | $9.22 million |
| Sep 2023 | $9.08 million |
| Dec 2023 | $7.97 million |
| Jan 2024 | $9.07 million |
| Mar 2024 | $8.29 million |
Source:
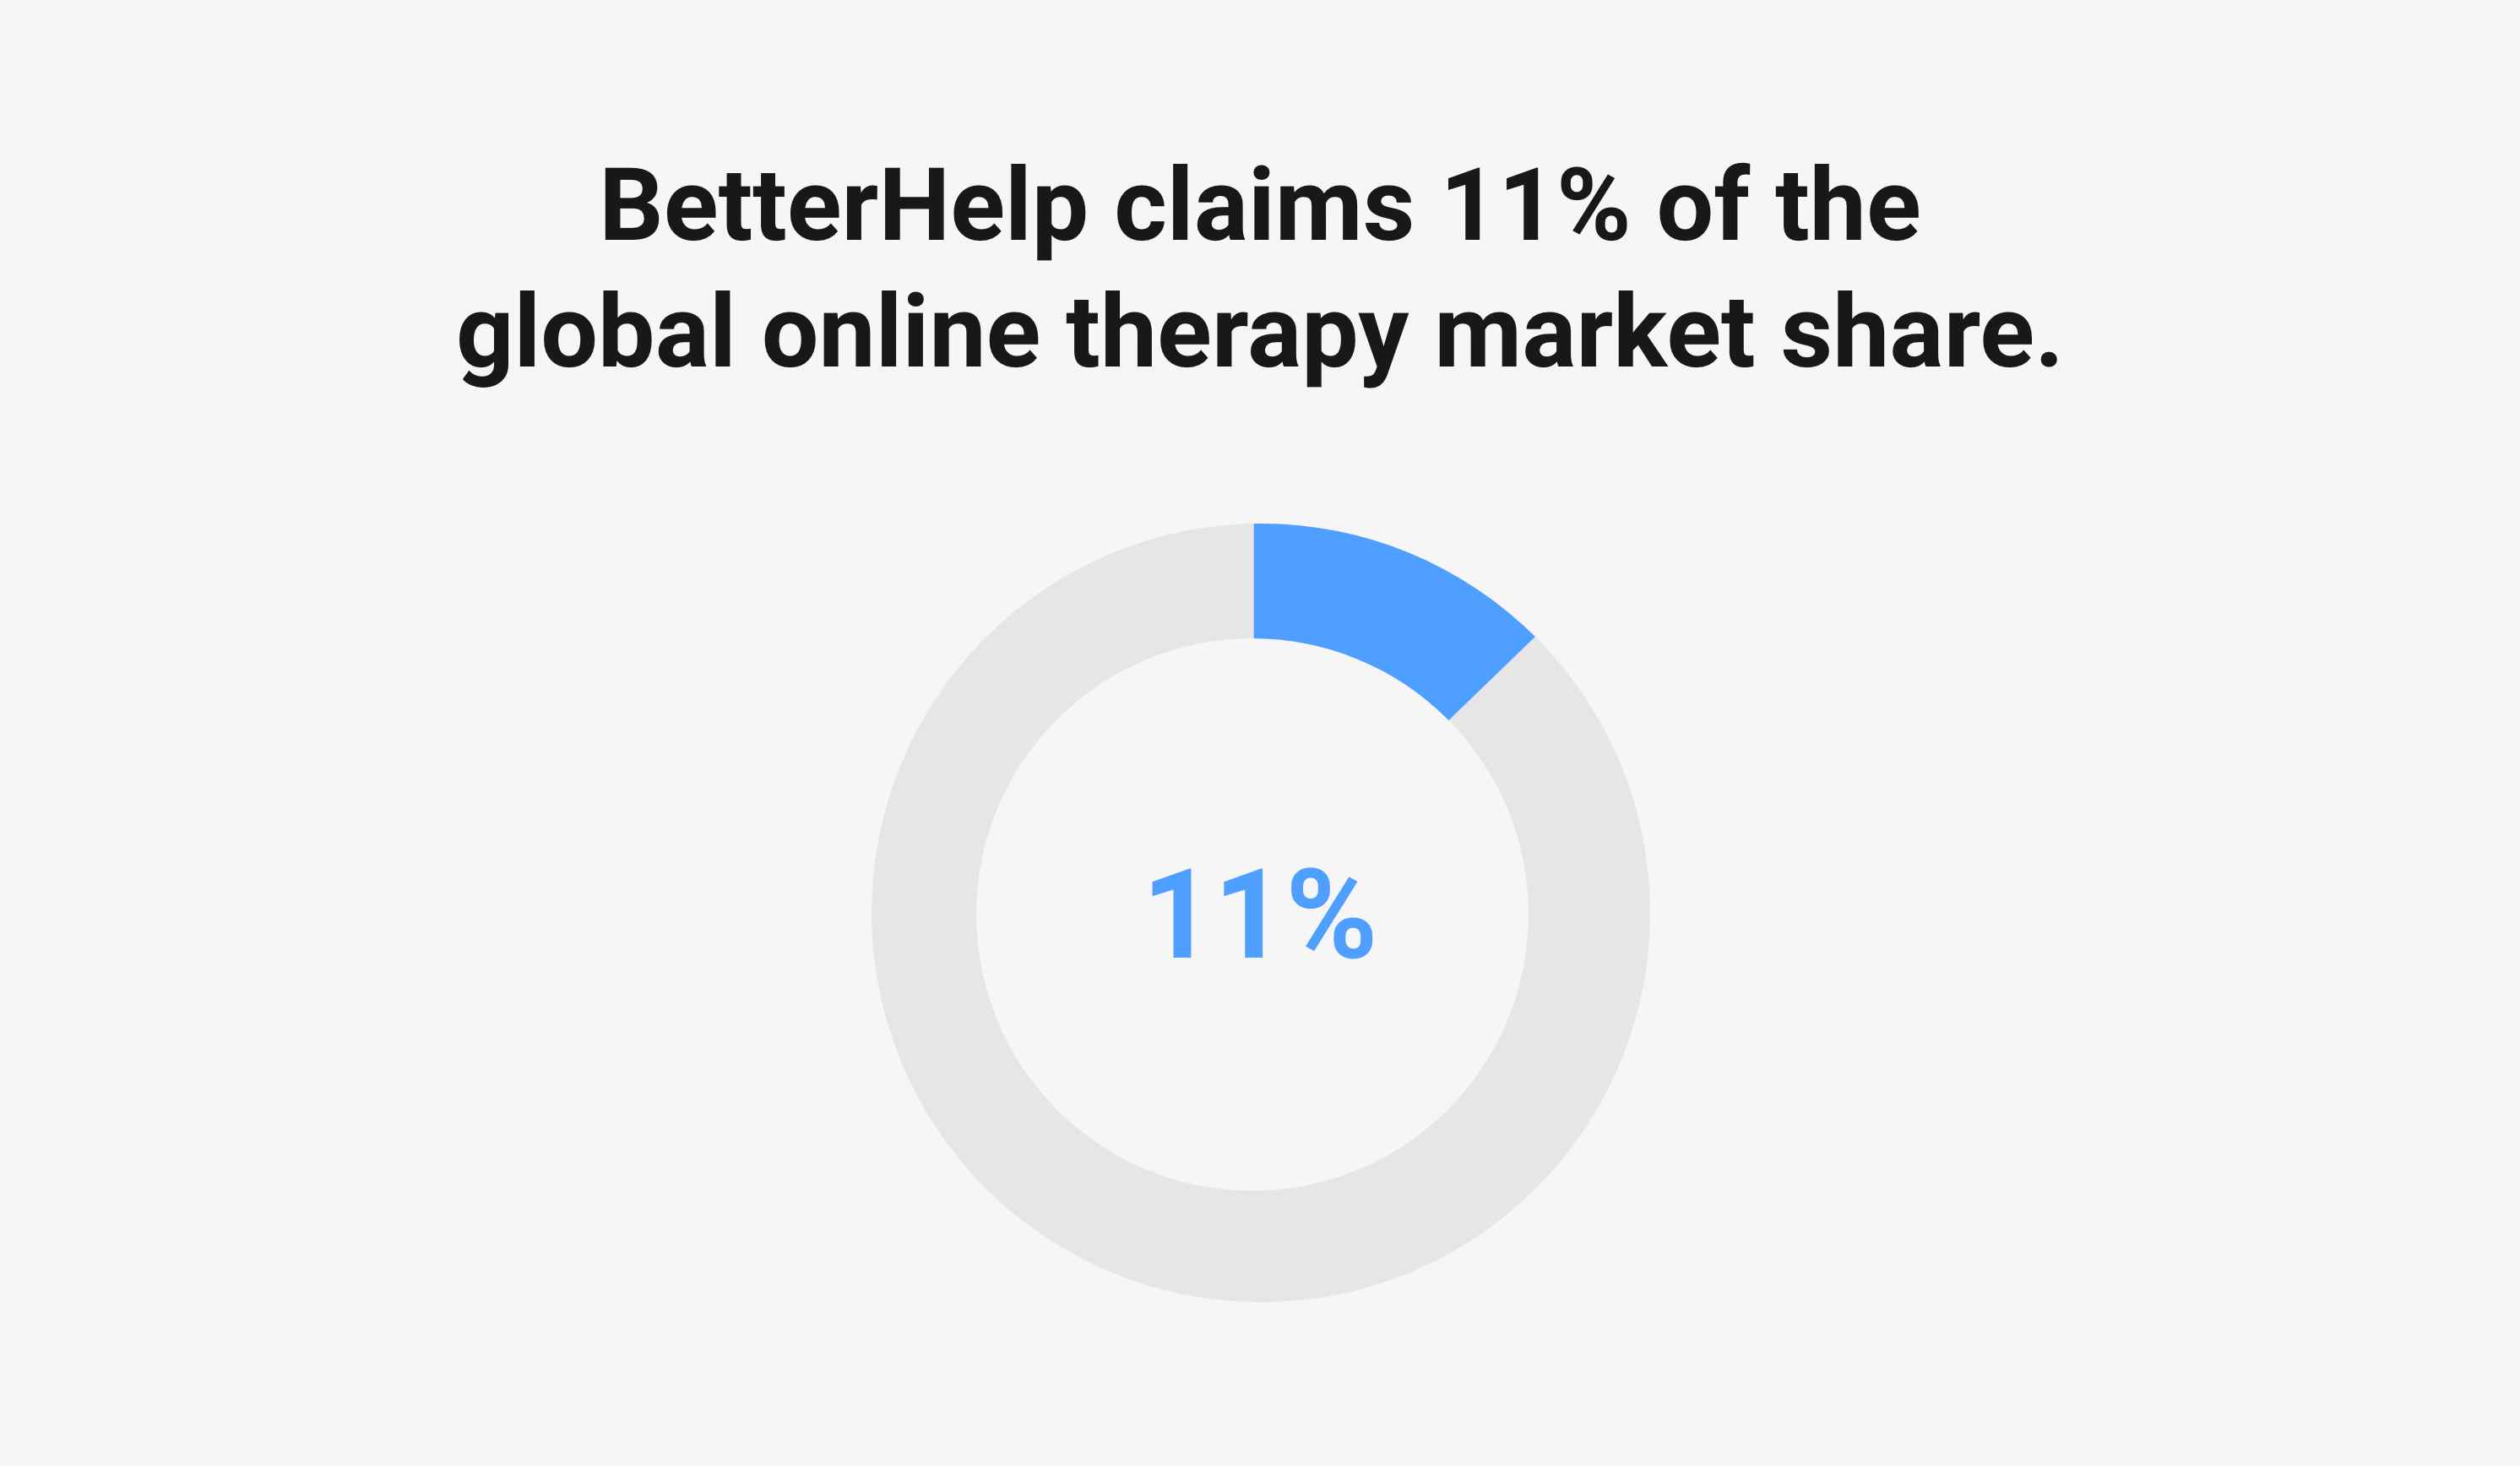
Magellan AIBetterHelp claims a 11.34% of the global online therapy market share. In 2023, the global market share was 9.7 billion, with BetterHelp accounting for 1.1 billion.
BetterHelp app downloads
The BetterHelp mobile app was downloaded 100,000 times in March 2024 on iOS. The Android version received 50,000 downloads in the same month.
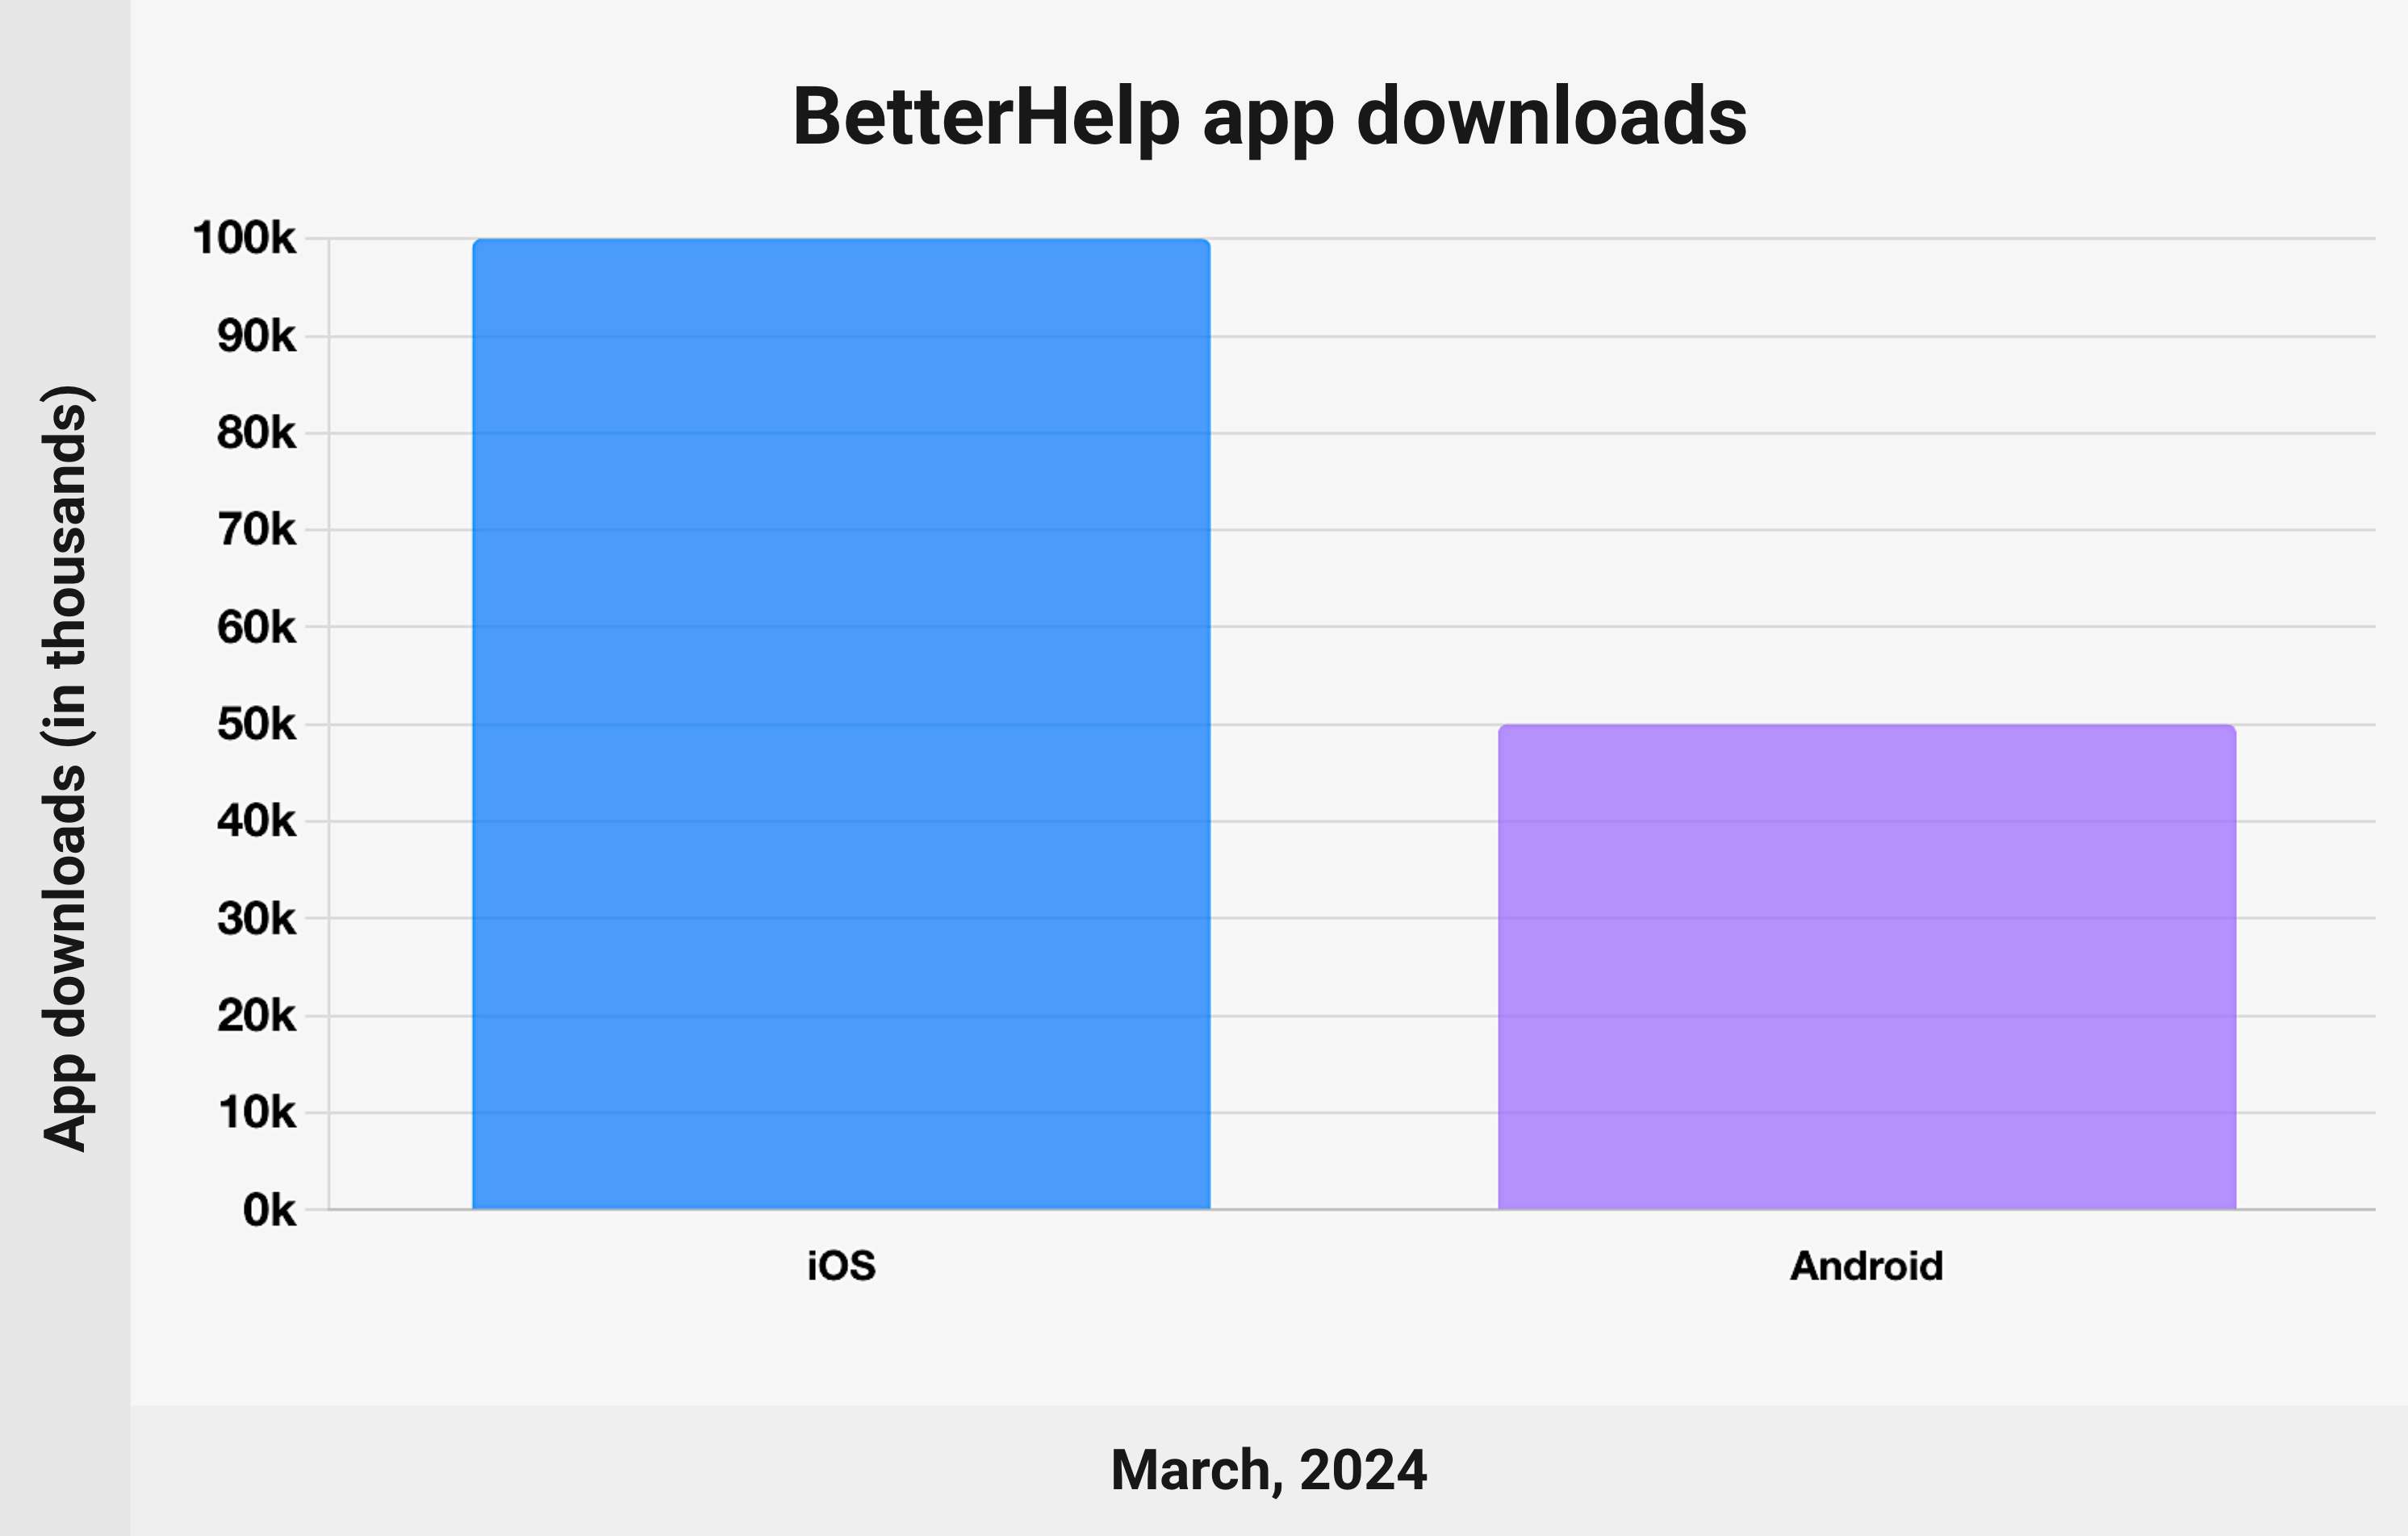
Here's a table of the BetterHelp mobile app downloads on iOS and Android in March.
| Platform | Downloads |
|---|---|
| iOS | 100,000 |
| Android | 50,000 |
Source:
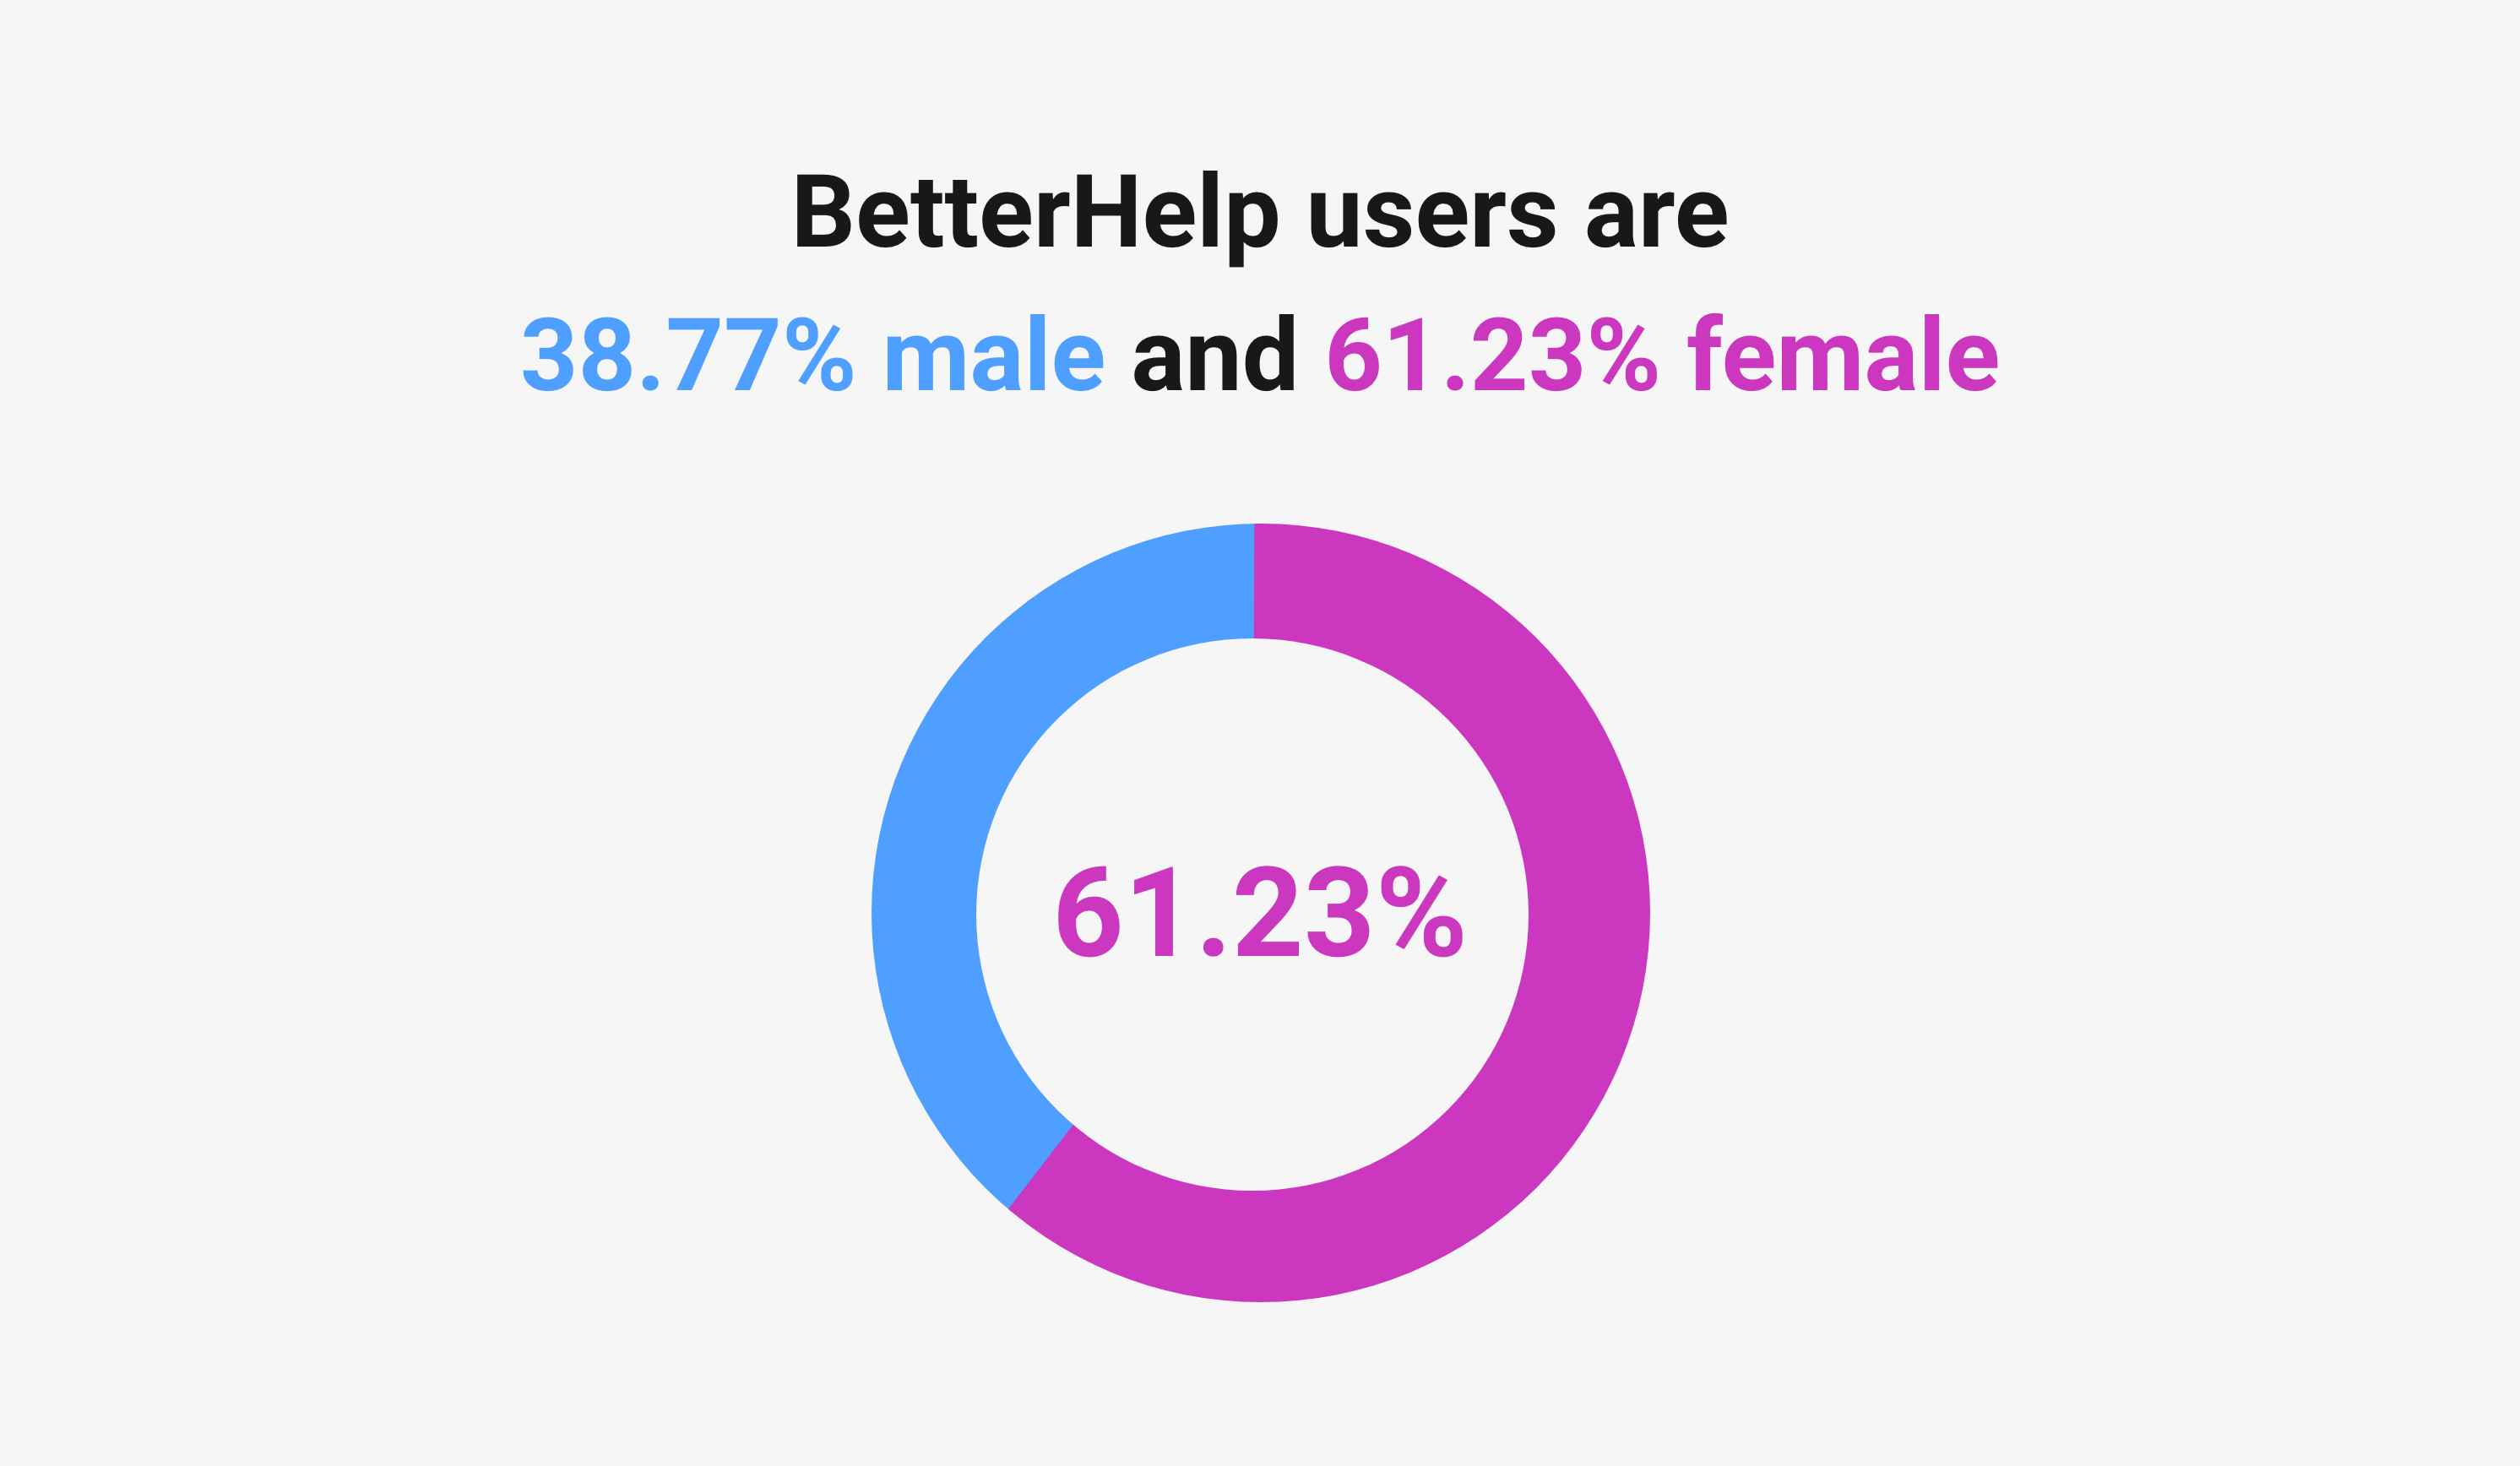
Sensor TowerBetterHelp gender demographics
61.23% of BetterHelp's users are female. 38.77% are male.
Source:
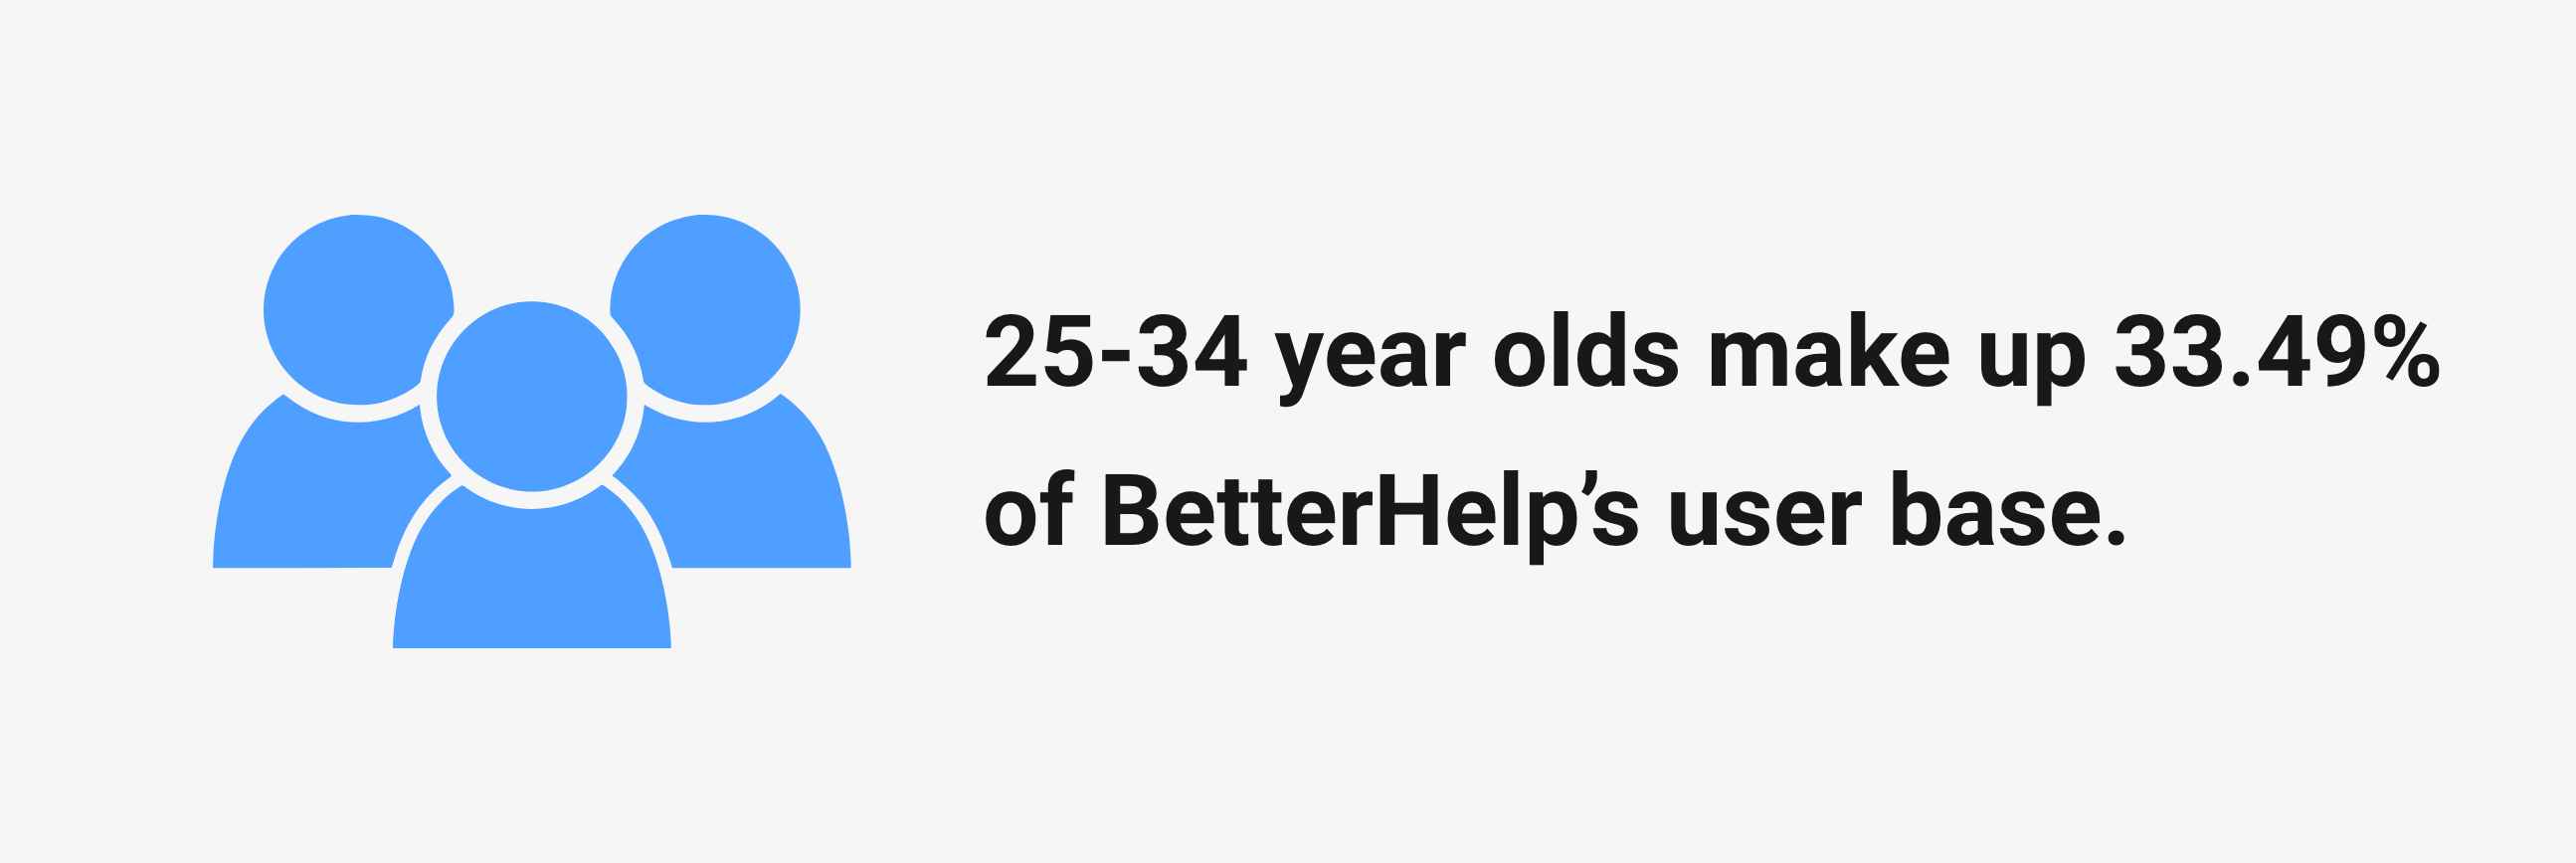
Similar WebBetterHelp age demographics
25-34 year olds make up 33.49% of BetterHelp's users. On the flipside, 65+ year old adults only make up 5.02% of users.
Here's a breakdown of BetterHelp's users by age (acending):
| Age Range | Percentage |
|---|---|
| 18 - 24 | 17.55% |
| 25 - 34 | 33.49% |
| 35 - 44 | 20.33% |
| 45 - 54 | 14.6% |
| 55 - 64 | 9.02% |
| 65+ | 5.02% |
Source:
Similar WebBetterHelp most popular countries
BetterHelp had over 10.2 million web users in March 2024 alone. A 1.13% increase from the month before.
The United States is the most popular country with 63.6% of the total web users.
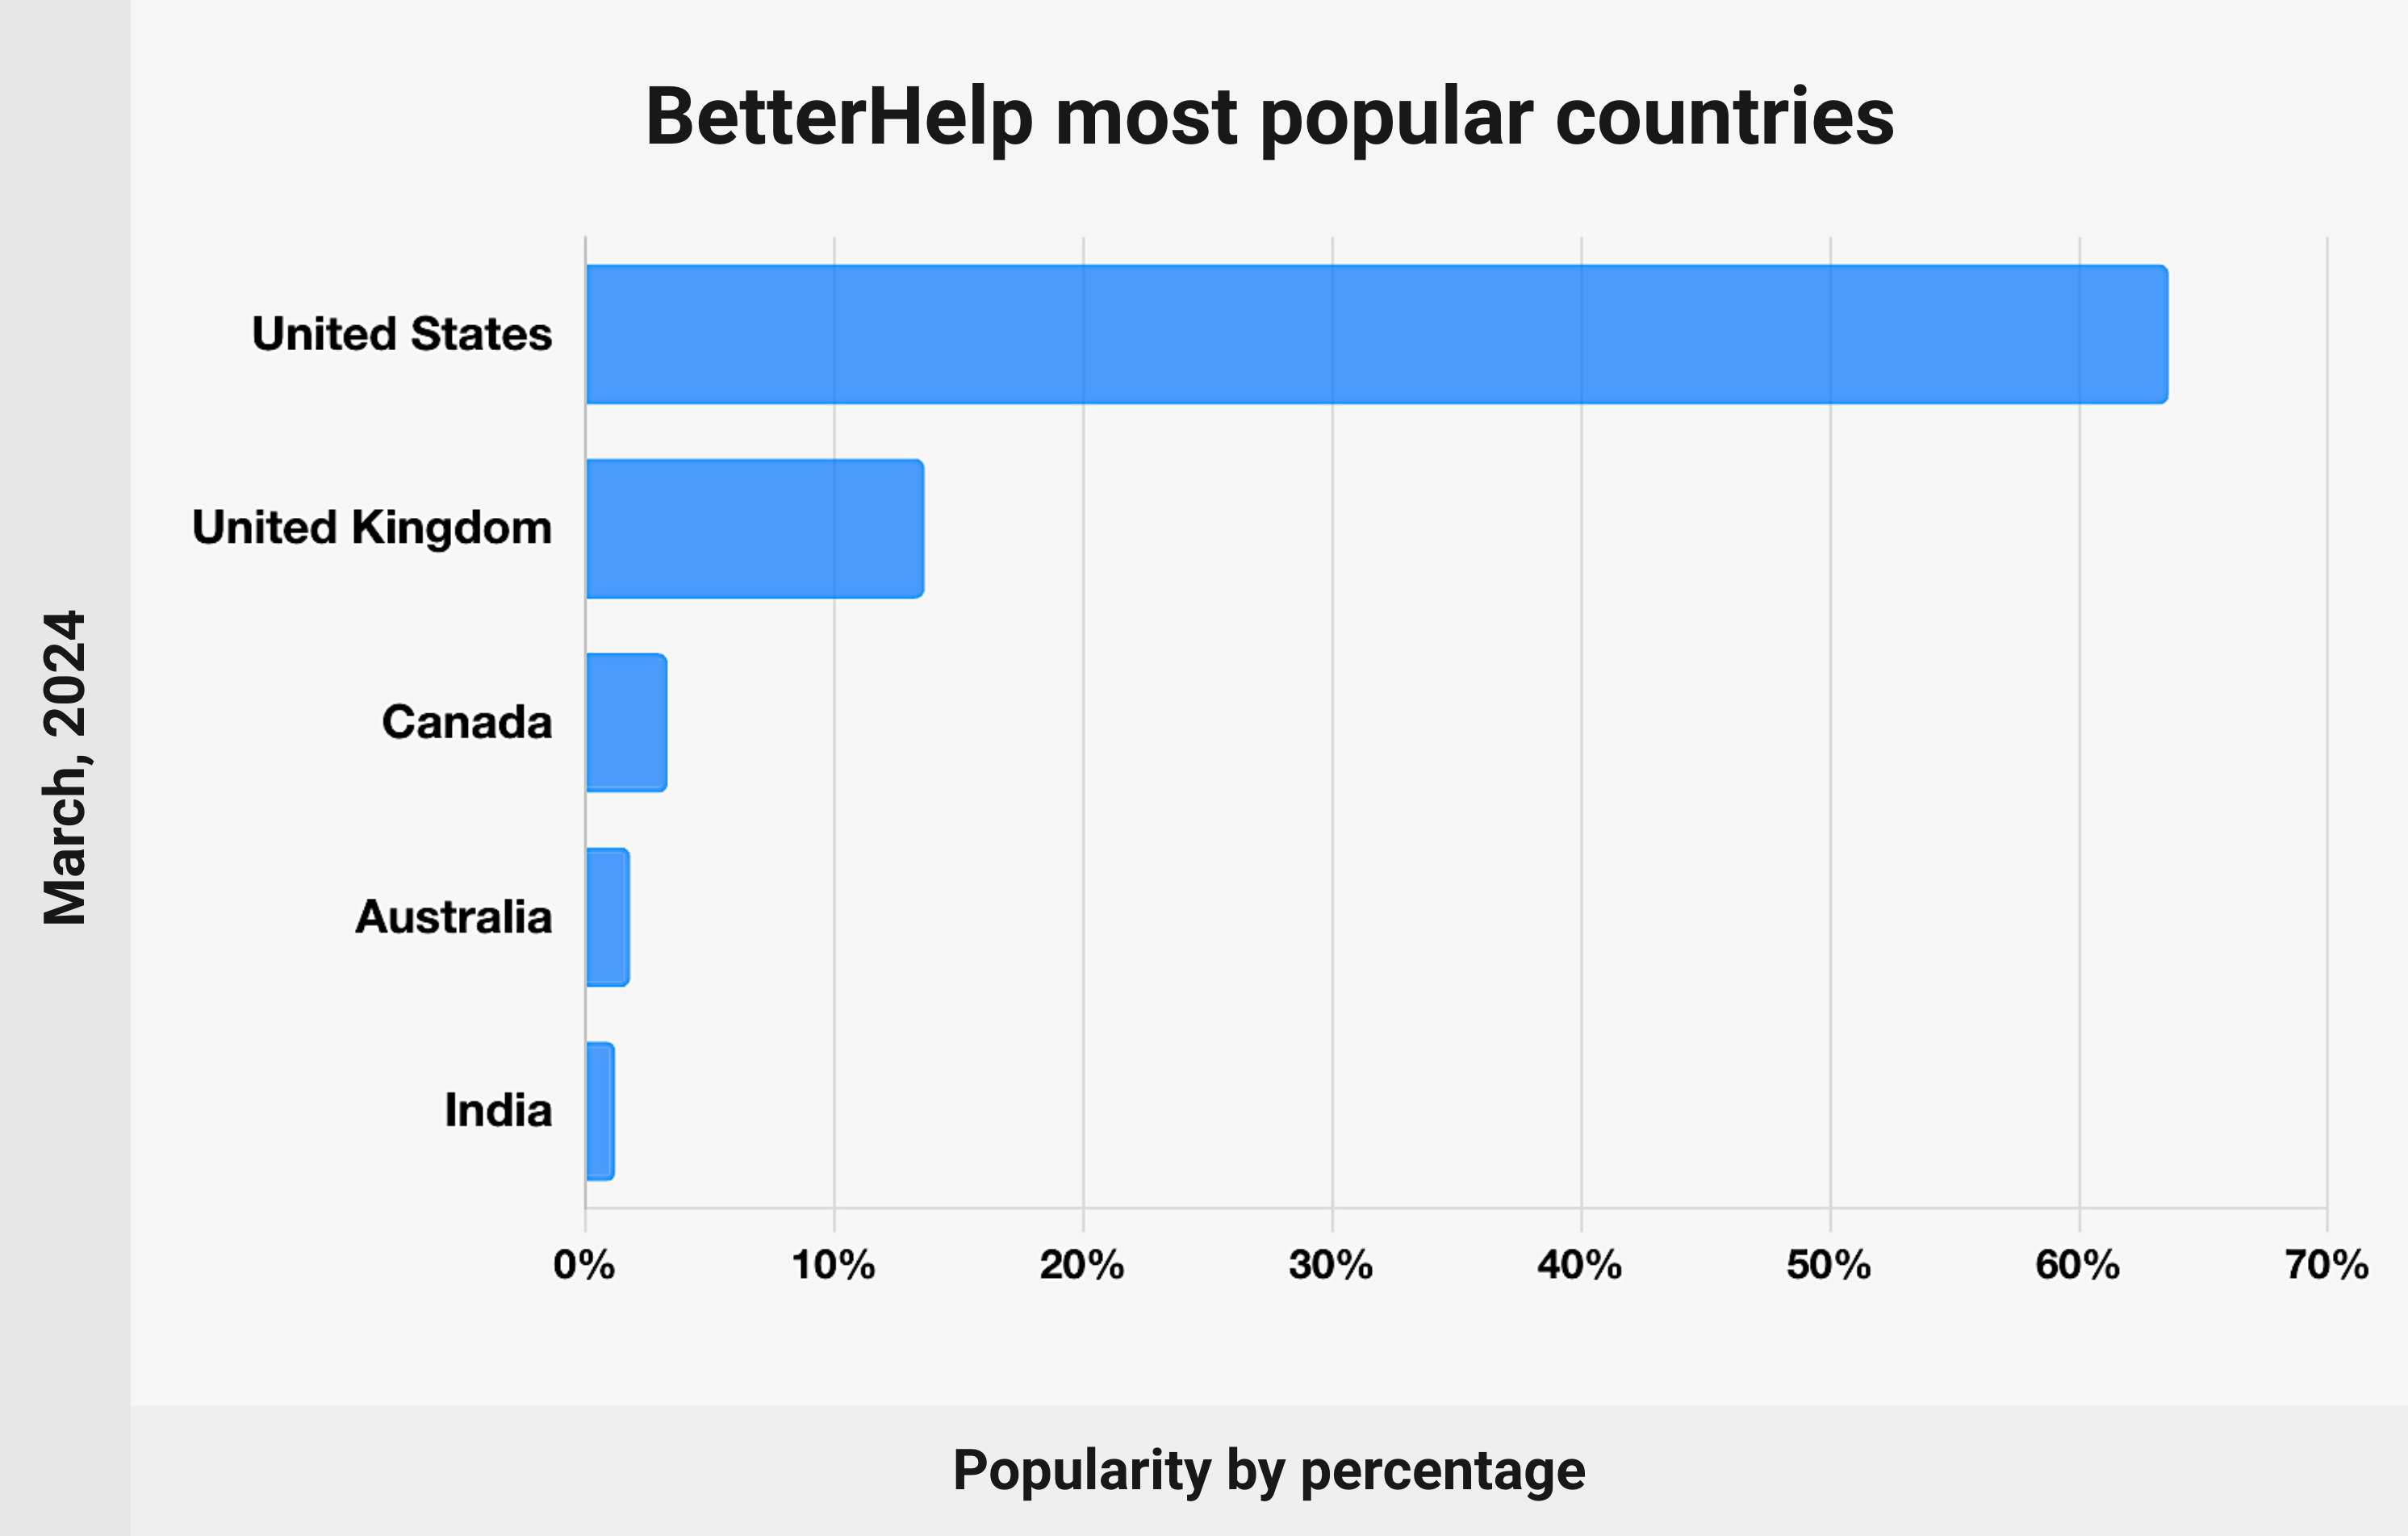
Here's a table of the countries with the most BetterHelp web users (percentage):
| Country | Percentage of Users |
|---|---|
| United States | 63.6% |
| United Kingdom | 13.62% |
| Canada | 3.3% |
| Australia | 1.81% |
| India | 1.21% |
| Others | 16.46% |
Source:
Similar WebBetterHelp has an average bounce rate of 51.15%, and an average visit duration of 2 minutes and 56 seconds.
BetterHelp ratings
BetterHelp has a 3.2 stars average on Indeed.com, with the work-life balance at a 3.8.
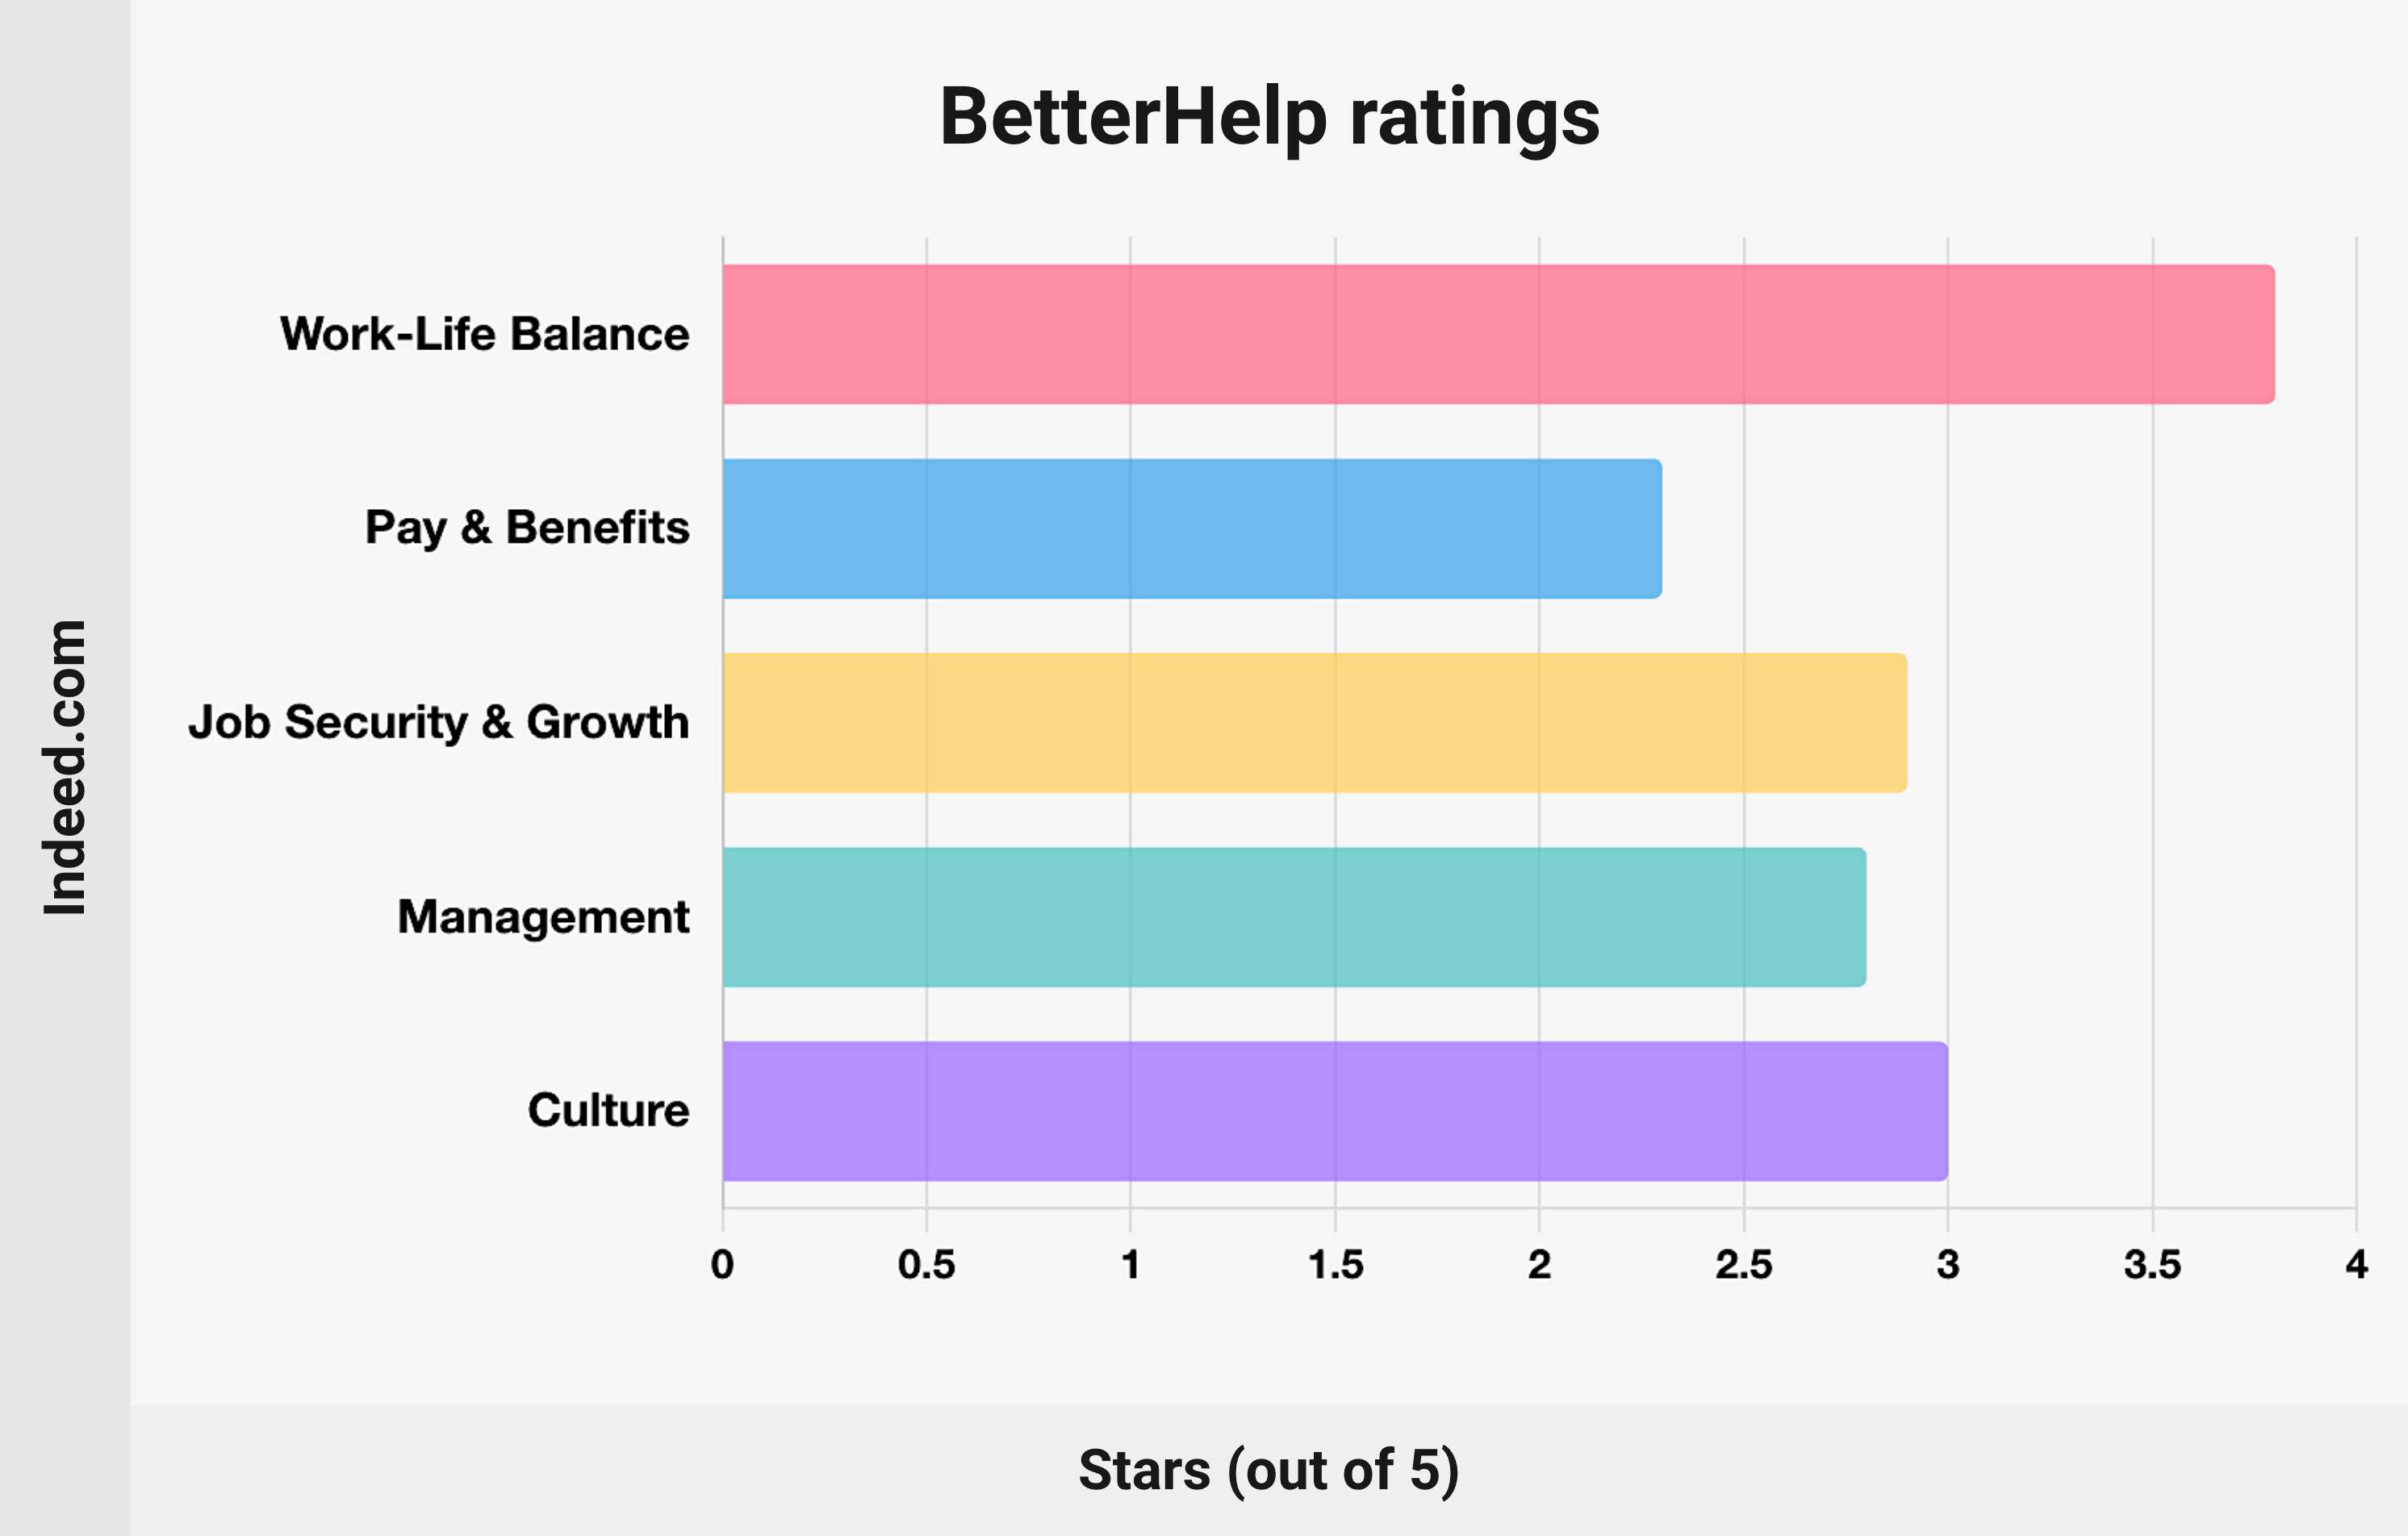
Here's a table with the average ratings for each category.
| Category | Rating |
|---|---|
| Work-Life Balance | 3.8 |
| Pay & Benefits | 2.3 |
| Job Security & Advancement | 2.9 |
| Management | 2.8 |
| Culture | 3.0 |
Source:
Indeed.comHow many people work at BetterHelp
BetterHelp has 125 employees. 109 are women, 16 are men. Employees tend to stay with BetterHelp for 5.9 years on average.
Here's a table of the employee ethnicities represented.
| Ethnicity | Percentage |
|---|---|
| White | 50% |
| Hispanic or Latino | 23% |
| Asian | 13% |
| Other | 16% |
Source:
ZippiaConclusion
That's all for our list of BetterHelp stats in 2024. The online therapy platform has been busy marketing itself across various platforms; namely podcasts.
Although its been a bit of a bumpy ride recently for BetterHelp, attributed to losing some of its customer base.
The company seems to still be in a stable financial position moving forward.


